Infographics are a visual representation of data, stories, intellectual capital, and other information. Generally speaking, infographics aid in explaining complex data or information.

For digital applications, infographics must be created as PNG or SVG file formats for content body sections. These file formats are the best at displaying illustrated and typographic content. Infographics must always have accompanying accessibility information.

Consult Brand Central for Infographic Guidelines.

Sample Image

<img src="/images/example-infographic-name-here.svg" alt="Infographic basic description. Described under the heading Infographic description.">

<h2>Infographic description</h2>

<p>Add content here that describes everything communicated in the infographic. Any data point or proof point mentioned in the image must be repeated here.</p>

UX and design guidance for infographics is found on Brand Central - Infographics.

  • Do not overload your infographics with information
  • Always follow accessibility guidance.
  • Always include the text-based content immediately underneath the image, and define the connection for users. (See more in the A11y tab)

Infographics are complex, so they need appropriate accessibility information defined.

Our approach is based on the guidance found on Web Accessibility Tutorials - Complex Images - Approach 2.

Place your image on the page - always have an alt tag. In the example below, a <h4> is used, but this should reflect the location on the page. For example, if your page only has a <h1> tag in the header, you may use a <h2> here.

<img
 src="/images/example-infographic.svg"
alt="Infographic explaining employee views from the pandemic. Described under the heading Infographic description.">

<h4>Infographic description</h4>
<p>...full description of all content in the infographic here. Do not change terminology or editorialize. This description should convey exactly what is conveyed in the infographic itself.</p>
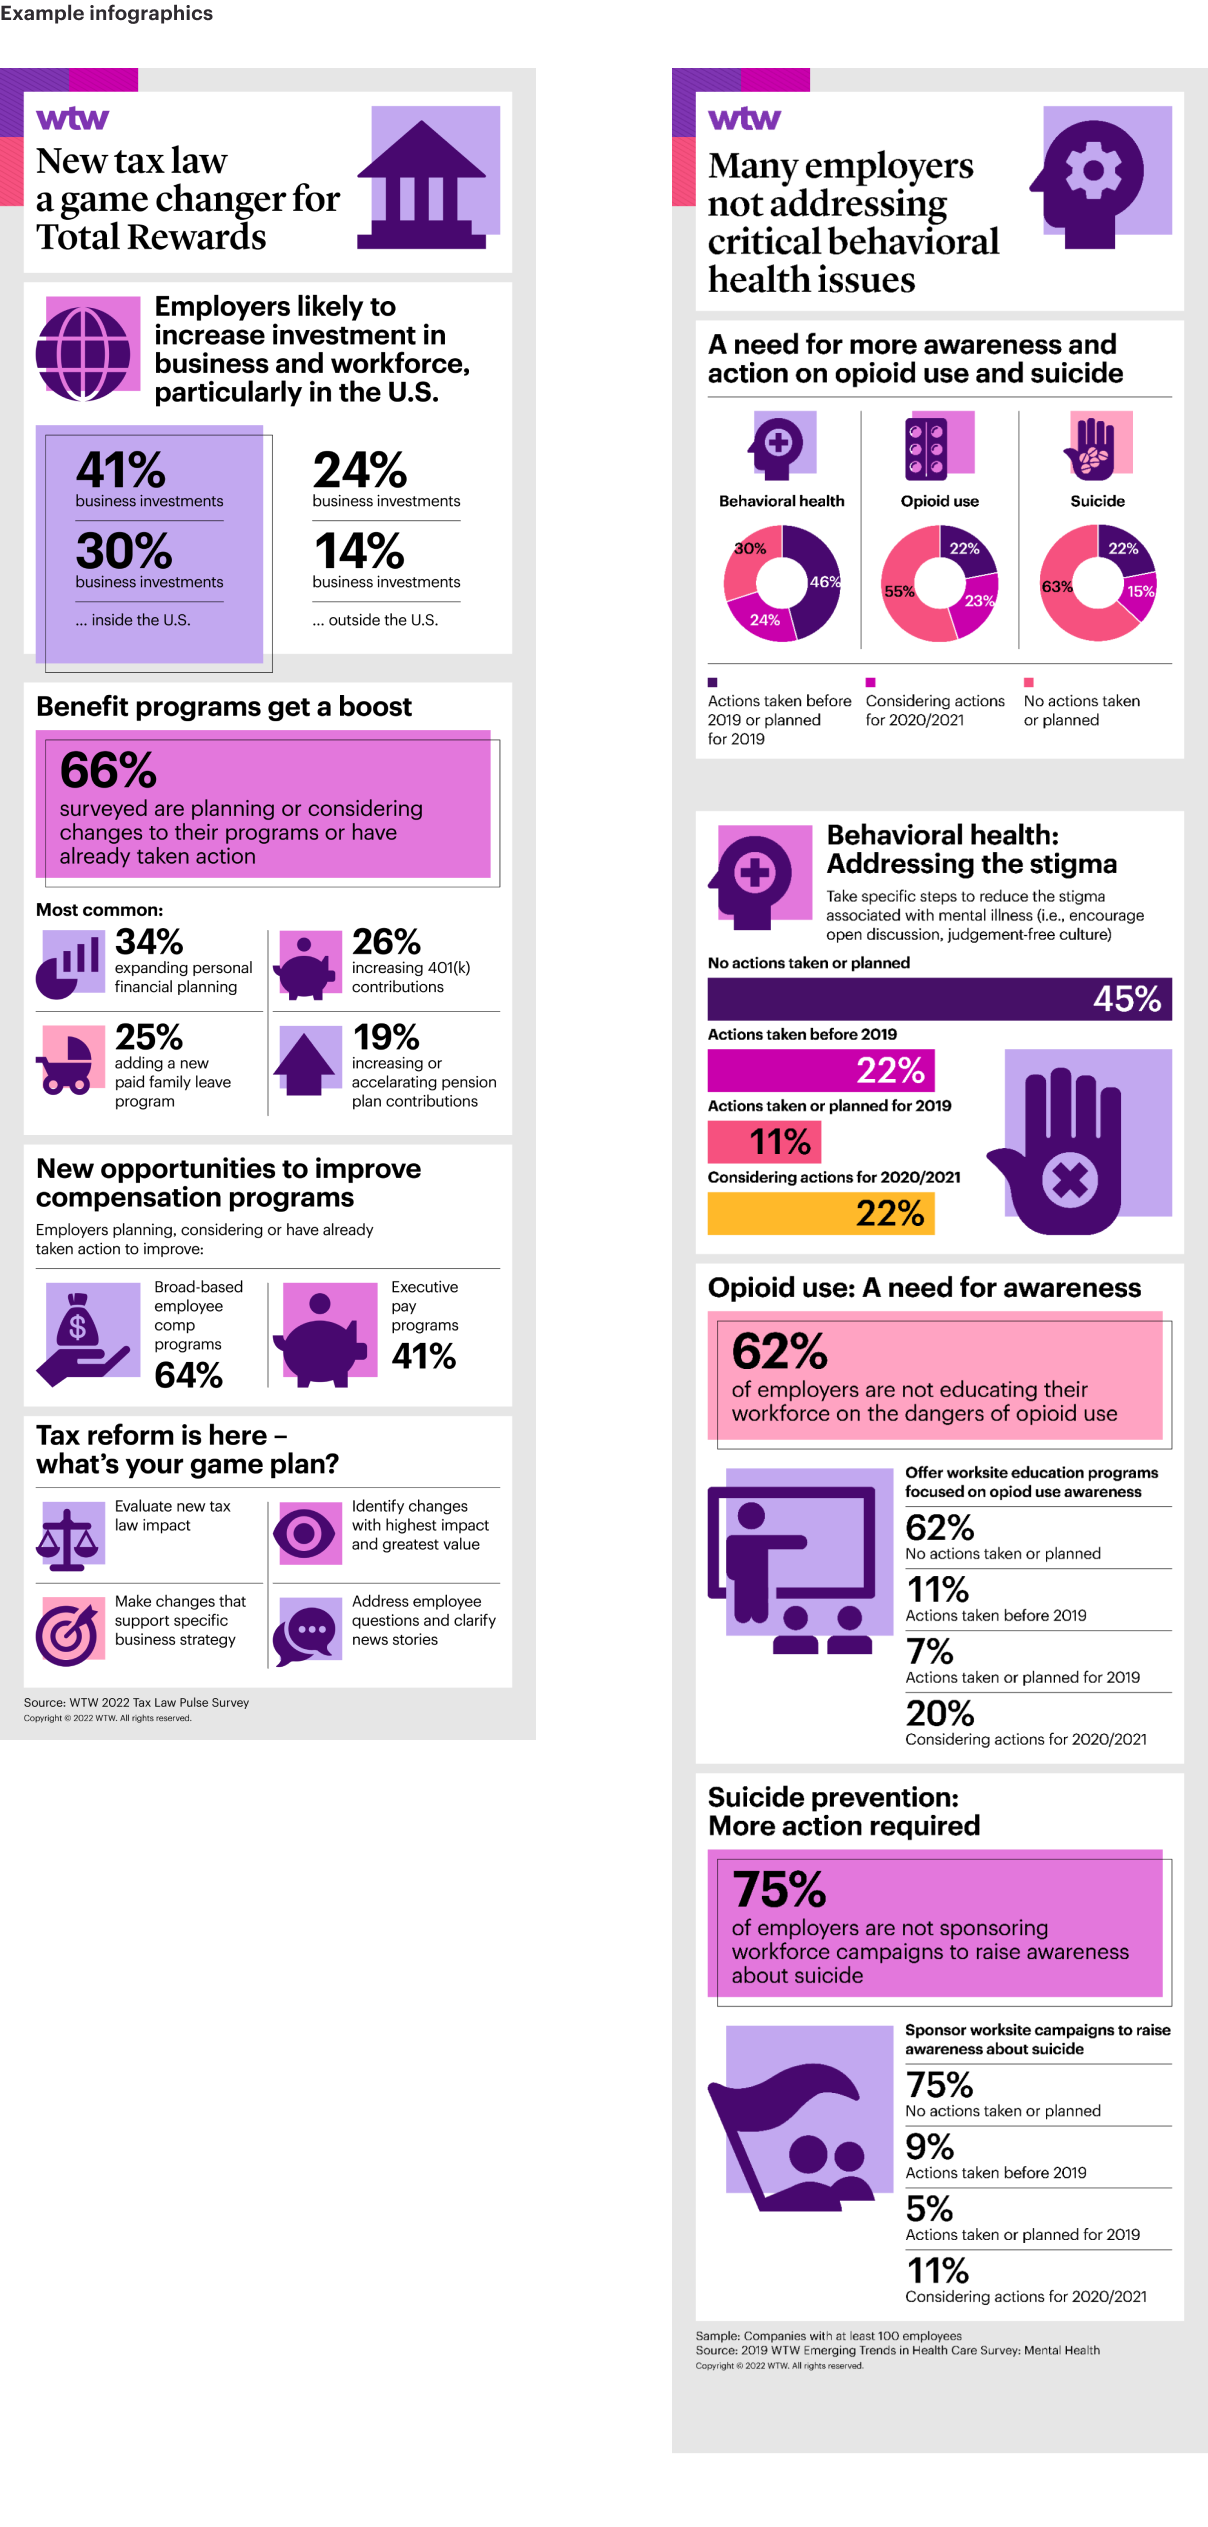
On WTWco.com, always use the designated Sitecore image component. Enter accessibility information as defined.

Within the alt=”” attribute, add a brief description of the infographic, and include the text “Described under the heading Infographic description”.

If you have have multiple infographics on a page, this process must be repeated for each image in order to provide context for screen reader users that the description is directly describing the infographic.

Our approach is based on the guidance found on Web Accessibility Tutorials - Complex Images - Approach 2.

Place your image on the page - always have an alt tag. In the example below, a <h4> is used, but this should reflect the location on the page. For example, if your page only has a <h1> tag in the header, you may use a <h2> here.

<img
 src="/images/example-infographic.svg"
alt="Infographic explaining employee views from the pandemic. Described under the heading Infographic description.">

<h4>Infographic description</h4>
<p>...full description of all content in the infographic here. Do not change terminology or editorialize. This description should convey exactly what is conveyed in the infographic itself.</p>